On this page
Getting started
Chrome extension
Open the Popup for quick tools, analyze the current page with Agent Chat, or trace a problem in DevTools.
Keep your current window in focus
The extension prevents foreground activation by default. When an agent requests activation, the page stays in the background without switching tabs or bringing a window forward. Turn off this preference in settings when you want the agent to bring pages forward.
Work with the current page in Agent Chat
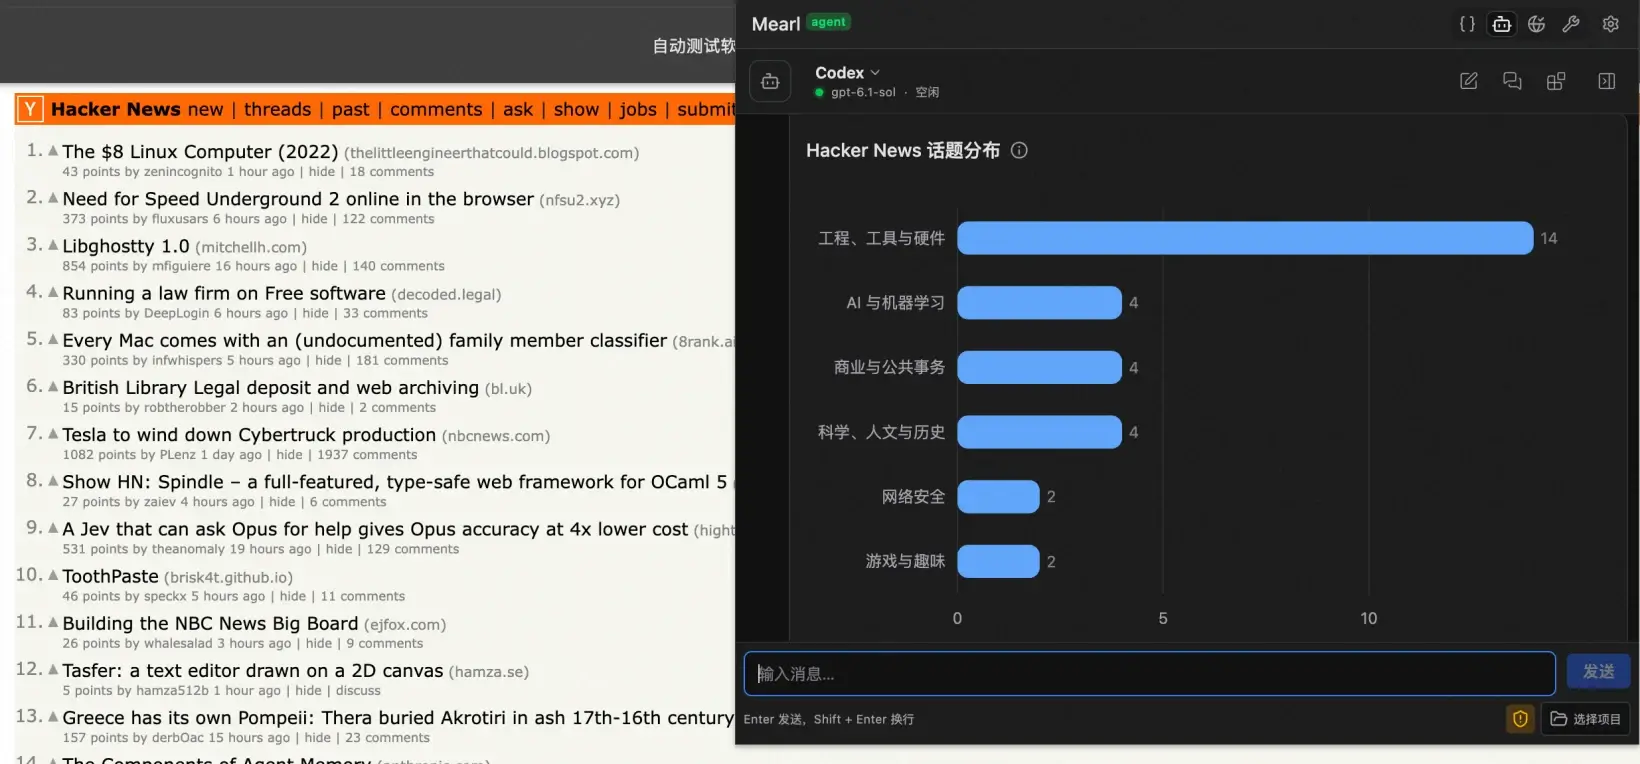
After local setup and agent configuration, open Agent Chat in the Popup and ask a question about the tab. You can ask Codex to summarize a list and return a chart for review in the conversation. Continue in the side panel to point out a particular element or mark a place that needs attention.
Read the visible Hacker News headlines, group them by topic, and show the counts in a bar chart.
Trace a problem in DevTools
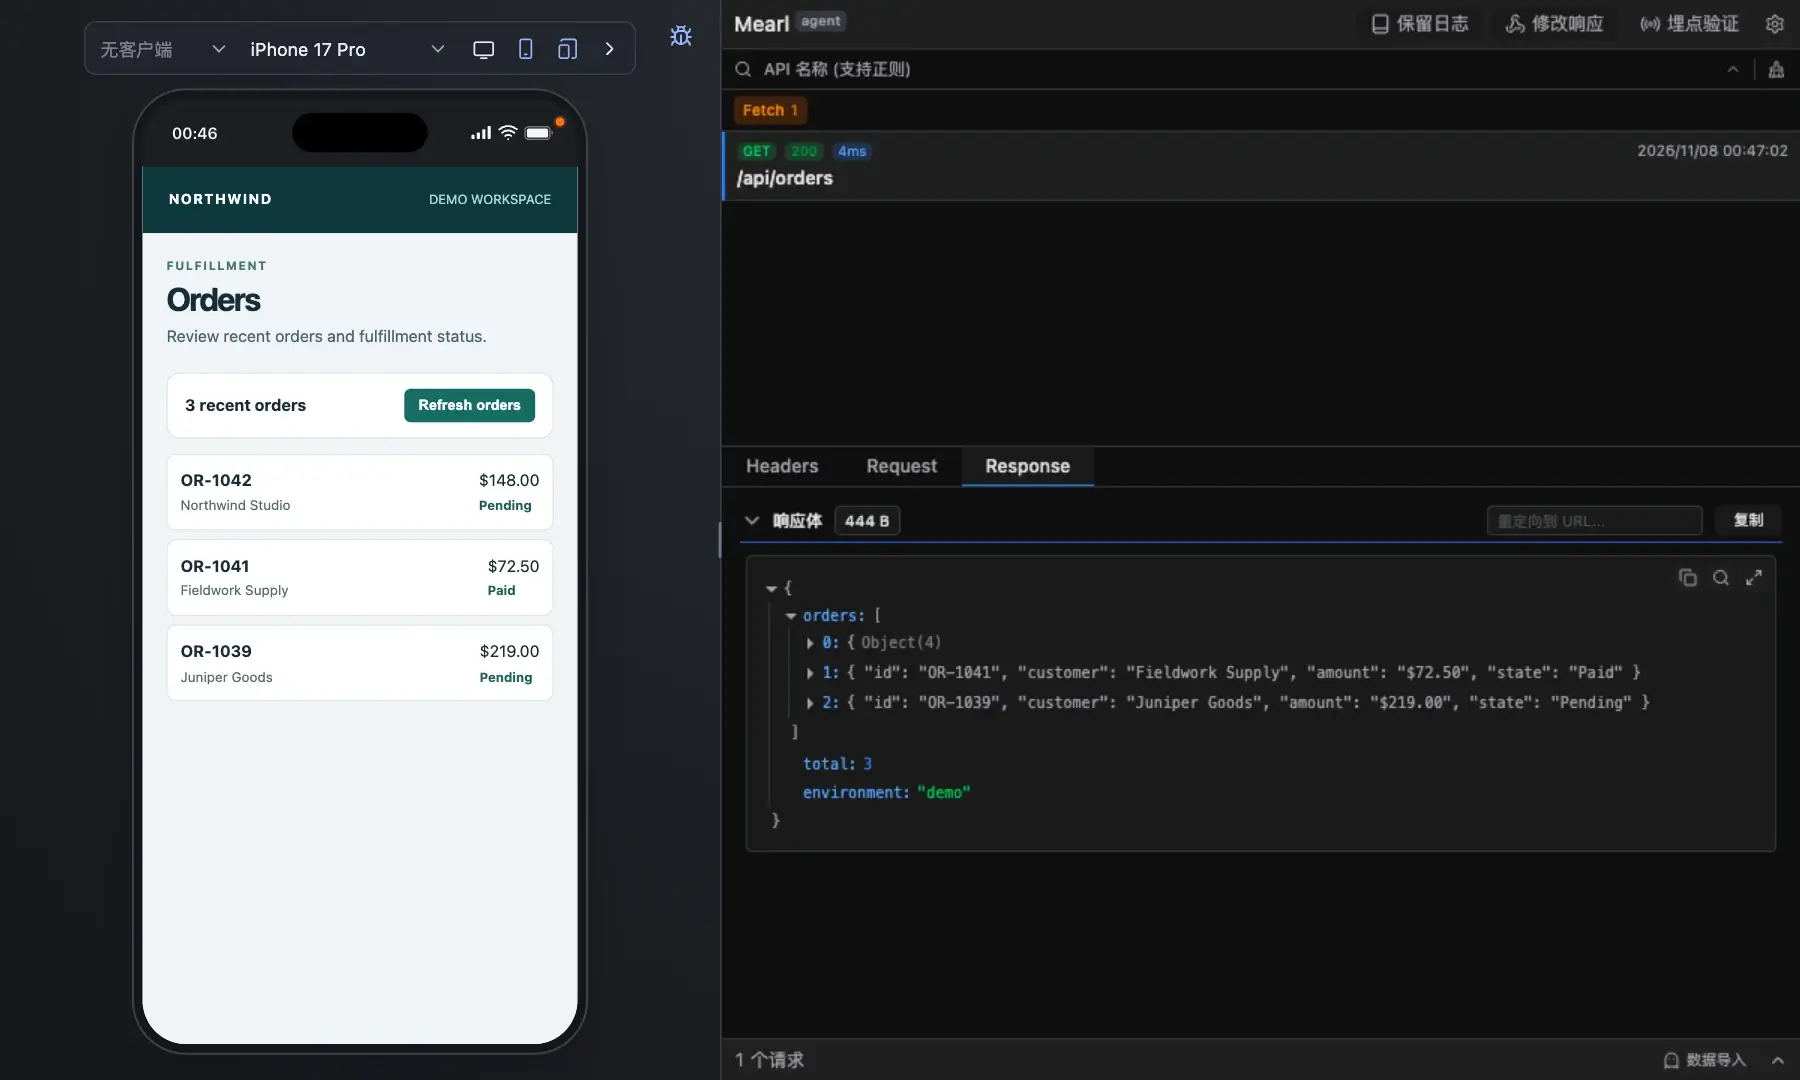
Open DevTools on the page you want to inspect and choose Mearl. If clicking Refresh leaves an order list blank, reproduce it once and use the request and console views to determine whether the response failed or the page failed to render it.
- Inspect the request status and response body, then check console errors from the same attempt.
- Replay the request to check whether the endpoint still returns the same result.
- Mock an empty response or an error and repeat the action to verify how the page handles it.
Open the Popup toolbox
Click Mearl in the Chrome toolbar. Open a pinned tool directly or choose Toolbox to see the other tools.
Inspect JSON and URLs
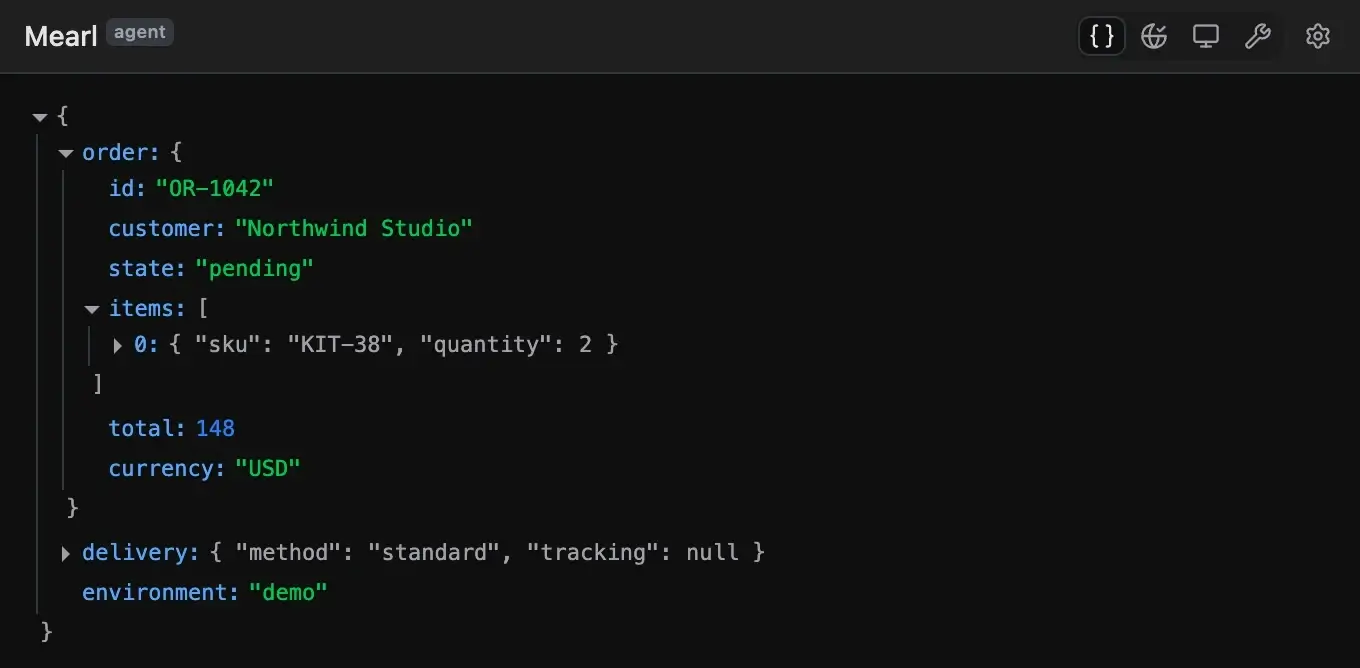
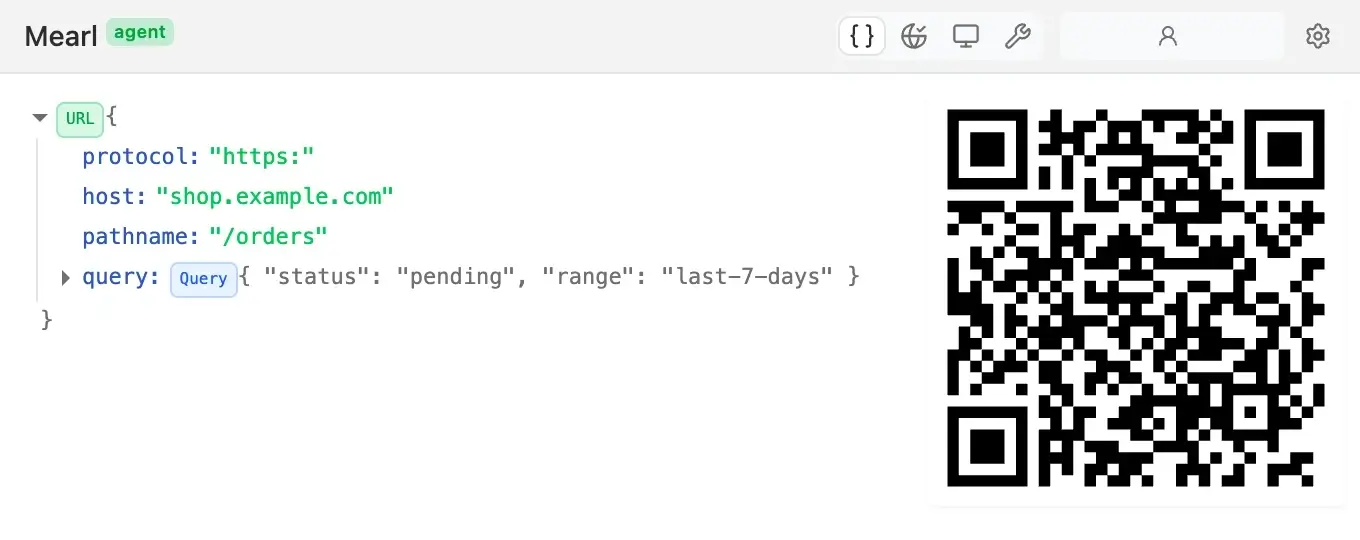
Open Data Formatter and paste JSON or a URL. Expand and search fields, edit values, and copy the result. For a URL, you can also edit query parameters or copy a QR code to open it on your phone.
See the URL formatter
Change how a request is sent
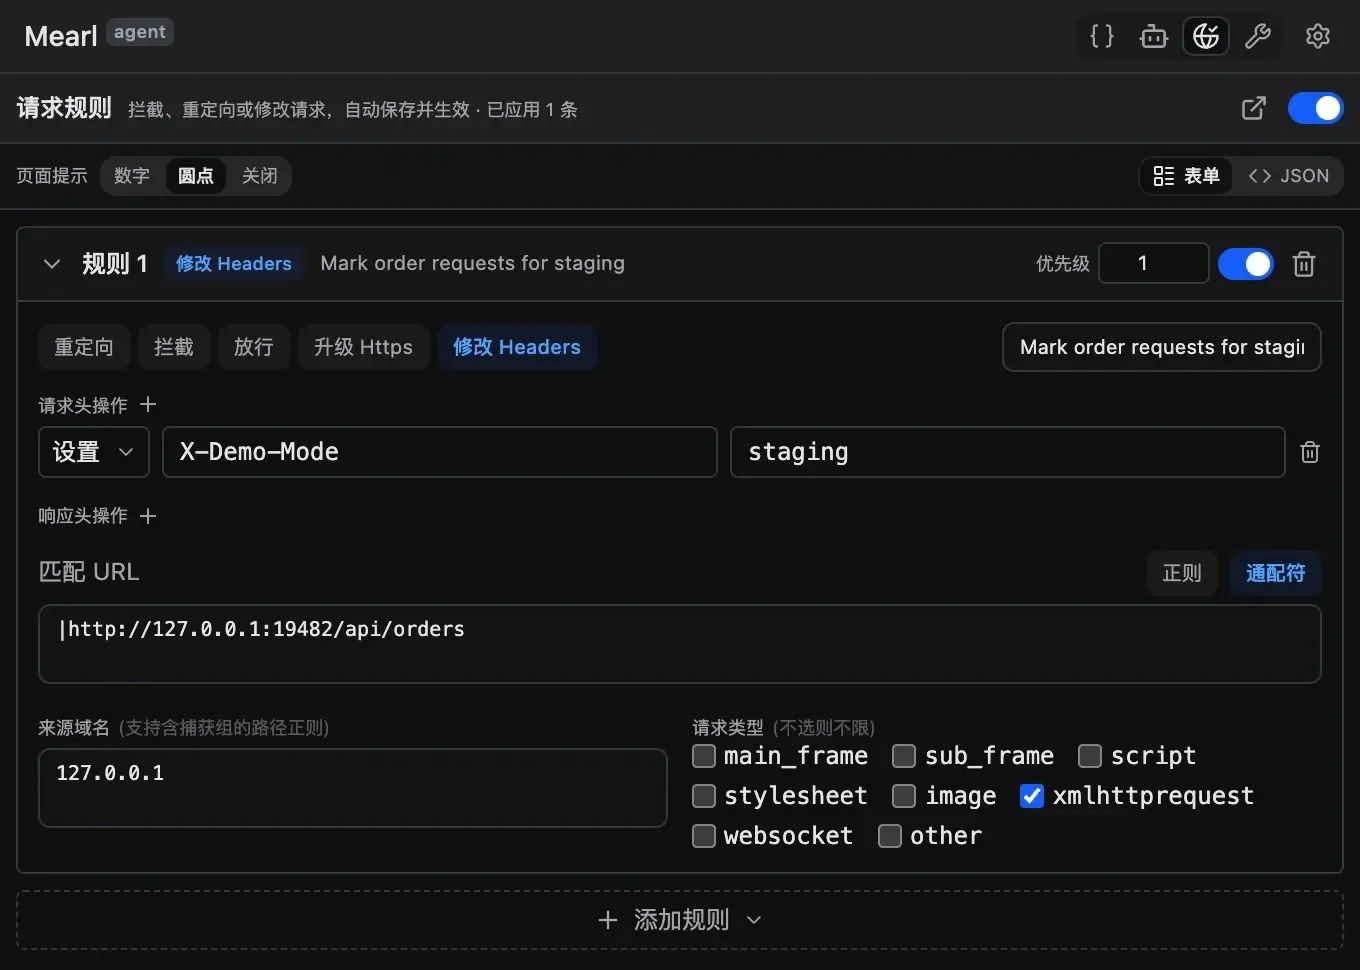
Open Request Rules to redirect traffic to a test endpoint or change a request header. Enable the rule, repeat the page action, and verify the request in DevTools.
Work with browsers and devices
- Browsers
- See connected browsers and control sessions. If an agent has access to several browser profiles, use this view to identify the one you want it to use.
- Device Debugging
- Capture requests from a connected physical device and inspect responses. This entry appears when the corresponding capture capability is enabled.
Add tools from Skill plugins
After setting up the local service, use Install tools in the Toolbox to find tools such as Notes, Format Converter, and Design Overlay. Once installed, you can put them in the toolbar alongside built-in tools.
Put the tools you use most at the top
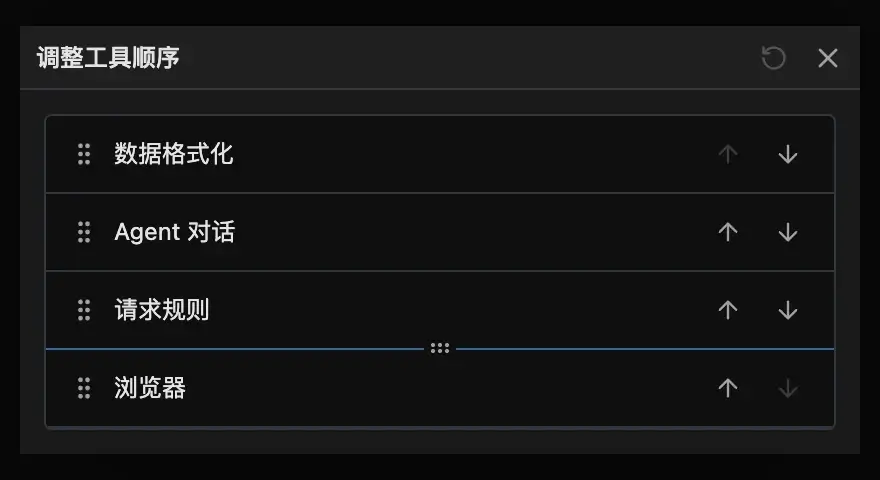
Open Toolbox → Reorder tools. Drag tools above the divider to put them in the Popup toolbar. Move the divider to control how many tools appear there.